1
Please refer to important disclosures at the end of this report
1
1
Quarterly Summary:
Y/E March (` cr)
Q3FY20
Q3Y19
% yoy
Q2FY20
% qoq
Revenue
10,354
10,444
(0.9)
9,620
7.6
EBITDA
1,973
1,595
23.7
1,918
2.9
OPM (%)
19.1
15.3
380bps
19.9
(80 bps)
Adjusted PAT
711
394
81
579
23
Source: Company, Angel Research
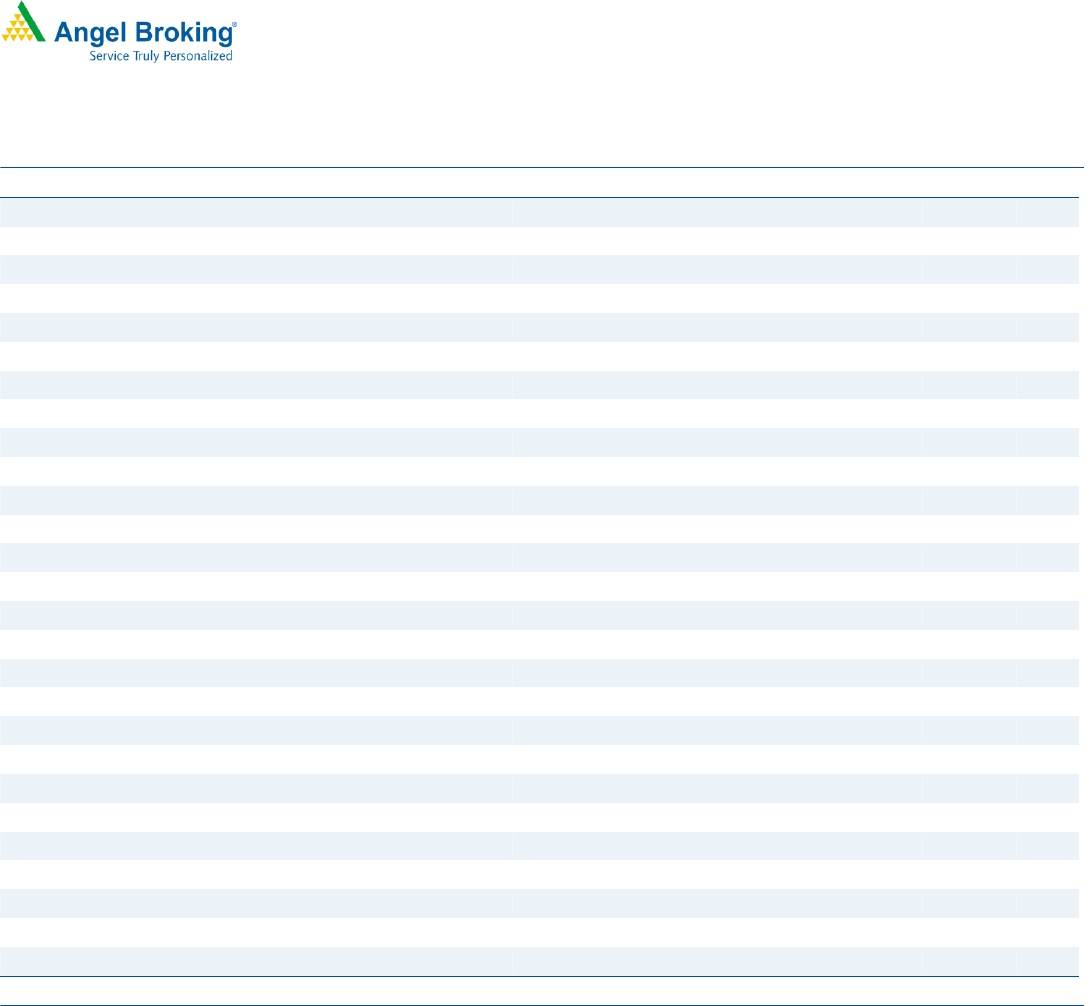
Robust performance in muted demand environment: In Q3FY20, consolidated
revenue declined by 1% while EBIDTA and PAT grew by 23.7% and 81% YoY
respectively. Operating margin also improved by 3.8% YoY to 19.1% due to
better realizations & cost control. Sales volume declined by 4% YoY to 20.9mn
tonne. EBIDTA/ tonne increased by 35.5% YoY to `1004.
Favorable Cost trends (excluding Century Cement): Logistics cost as well as
energy cost declined 5% and 15% YoY to `1108 and `941 per tonne respectively.
Raw material cost and other cost (excluding Sabka Vishwas charge) increased by
2% and 6% YoY to `941 and `707 per tonne respectively. During the quarter
`133cr. was incurred for one time settlement against contingent and other
disputed liabilities of `832cr. of Sabka Vishwas Scheme.
Expansion Plan: 3.4 mtpa grinding capacity expansions in the Eastern markets
and Dalla SuperUnit, which is a 2.3 mtpa clinker plant are expected to be
commission by March 2021. The Phase-II of Bara is expected to be commissioned
by September 2020.
Outlook and Valuation: We are positive on the long term prospects of the
Company given ramp up from acquired capacities, pricing discipline in the
industry and benign energy & freight costs. We maintain our “Buy”
recommendation on UltraTech by valuing it at 13x FY22E EV/EBIDTA to arrive at
a target price of `5373.
Key Financials
Y/E March (` cr)
FY18
FY19
FY20E
FY21E
FY22E
Net Sales
30,978.6
37,379.2
43,687.9
47,182.0
51,811.7
% chg
22.1
20.7
16.9
8.0
9.8
Net Profit
2,224.6
2,431.1
4,001.4
5,109.3
6,175.3
% chg
-18.0
9.3
64.6
27.7
20.9
EBITDA (%)
19.8
18.2
22.6
23.6
24.0
EPS (Rs)
80.9
88.7
138.6
177.0
214.0
P/E (x)
55.4
50.6
32.4
25.3
21.0
P/BV (x)
4.7
4.3
3.5
3.1
2.7
RoE (%)
8.75
8.89
12.18
12.88
13.77
RoCE (%)
10.92
9.58
13.31
14.59
16.67
EV/EBITDA
23.6
22.1
14.8
12.7
10.9
EV/Sales
4.7
4.0
3.3
3.0
2.6
Source: Company, Angel Research (Valuation done as on 30/01/20)
BUY
CMP `4486
Target Price `5373
Investment Period 12 months
Stock Info
Sector
Bloomberg Code
Shareholding Pattern (%)
Promoters
MF / Banks / Indian Fls
FII / NRIs / OCBs
Indian Public / Others
Abs. (%) 3m 1yr 3yr
Sensex 1.5 14.9 46.9
Ultraterch Cement 8.9 31.6 22.4
Cement
BSE Sensex
40,913
Nifty
12,035
ULTC.NS
Reuters Code
UTCEM:IN
60.2
13.1
17.6
9.1
Net Debt (` cr)
Market Cap (` cr)
129,474
86,225
Beta
1.3
52 Week High / Low
4905/3365
Avg. Daily Monthly Volume
633,517
Face Value (`)
10
Price Chart
Source: Company, Angel Research
Research Analyst
Jyoti Roy
+022 39357600, Extn: 6842
jyoti.roy@angelbroking.com
Keshav Lahoti
+022 39357600, Extn: 6363
keshav.lahoti@angelbroking.com
3,000
3,500
4,000
4,500
5,000
5,500
Feb-17
May-17
Jul-17
Oct-17
Jan-18
Apr-18
Jul-18
Oct-18
Jan-19
Apr-19
Jul-19
Oct-19
Jan-20
UltraTech Cement
Performance Update
Q3FY2020 Result Update | Cement
January 30, 2020

2
UltraTech Cement | Q3FY2020 Result Update
January 30, 2020
2
Q3FY20 Performance
Y/E March (` cr)
Q3FY20
Q3Y19
% yoy
Q2FY20
% qoq
FY2020E
FY2019
% chg
Net Sales
10353.8
10444.1
-0.9
9620.5
7.6
43687.9
37379.2
16.9
Cost of Materials Consumed
1788.1
1779.7
0.5
1523.8
17.3
6944.1
6527.1
6.4
(% of Sales)
17.3
17.0
15.8
15.9
17.5
Employee Benefit Expense
620.0
597.1
3.9
638.4
-2.9
2487.4
2058.8
20.8
(% of Sales)
6.0
5.7
6.6
5.7
5.5
Power & Fuel
2039.4
2480.0
-17.8
1965.8
3.7
8934.2
8427.9
6.0
(% of Sales)
19.7
23.7
20.4
20.5
22.5
Freight & Forwarding Expense
2343.8
2552.1
-8.2
2115.5
10.8
9609.9
8846.7
8.6
(% of Sales)
22.6
24.4
22.0
22.0
23.7
Other Expenses
1589.4
1440.6
10.3
1459.0
8.9
5900.8
4730.5
24.7
(% of Sales)
15.4
13.8
15.2
13.5
12.7
Total Expenditure
8380.8
8849.6
-5.3
7702.4
8.8
33876.5
30591.0
10.7
Operating Profit
1973.0
1594.5
23.7
1918.1
2.9
9811.4
6788.2
44.5
OPM margin
19.1
15.3
19.9
22.5
18.2
Interest
470.8
478.4
-1.6
507.1
-7.2
1869.2
1548.5
20.7
Depreciation
673.0
638.1
5.5
668.4
0.7
2761.5
2139.8
29.1
Other Income
168.2
112.4
49.6
153.7
9.4
540.0
438.0
PBT (excl. Ext Items)
997.3
590.4
68.9
896.2
11.3
5720.7
3537.9
61.7
Exceptional item (Income)/Expense
0.0
0.0
0.0
6.2
0.0
0.0
0.0
Share of profit/ (loss) of associates & JV
0.1
0.2
-0.2
PBT (incl. Ext Items)
997.4
590.6
68.9
889.8
12.1
5720.7
3537.9
61.7
(% of Sales)
9.6
5.7
9.2
13.1
9.5
Provision for Taxation
286.2
196.8
311.3
1773.4
1106.8
Taxation pertaining to earlier years
0.0
0.0
0.0
0.0
0.0
(% of PBT)
28.7
33.3
35.0
31.0
31.3
Reported PAT
711.3
393.8
80.6
578.6
22.9
3947.3
2431.1
62.4
Adjusted PAT
711.3
393.8
578.6
3947.3
2431.1
PATM
6.9
3.8
6.0
9.0
6.5
Source: Company, Angel Research

3
UltraTech Cement | Q3FY2020 Result Update
January 30, 2020
3
Concall Highlights: Signs of demand revival were visible in some parts during the
latter part of Q3FY20. Phase-I of 2 mtpa Bara grinding unit has been
commissioned in January 2020. Company sold 0.6 MMT units in Bangladesh for
EV of $30mn. UltraTech Nathdwara has become PBT accretive. Nathdwara is
consistently operating at 60% utilization and generating `1500 plus EBIDTA/tonne
Cement prices dropped by 4% QoQ. Company has clarified that it has not bid for
Emami cement plant.
Further debt reduction: Net debt stood at `22,111cr. at the start of F.Y. which was
reduced by `1,492cr. in H1FY20. Net debt is further reduced by `1,994cr. during
the quarter to `18,625cr.
Downside risks to our estimates
Muted demand.
Reduced Infrastructure spends by Government.
Capacity addition at faster pace.
Delay in synergy benefits from inorganic expansion.

4
UltraTech Cement | Q3FY2020 Result Update
January 30, 2020
4
Consolidated Profit & Loss Statement
Y/E March (` cr)
FY2019
FY2020E
FY2021E
FY2022E
Revenue
37,379
43,688
47,182
51,812
% chg
20.7
16.9
8.0
9.8
Total Expenditure
30,591
33,826
36,054
39,378
Cost of Materials Consumed
6,527
6,945
7,650
8,482
Employee Benefit Expense
2,059
2,487
2,686
2,921
Power & Fuel
8,428
8,553
9,146
10,043
Freight & Forwarding Expense
8,847
9,610
10,378
11,397
Other Expenses
4,731
6,230
6,194
6,535
EBITDA
6,788
9,862
11,128
12,433
% chg
10.5
45.3
12.8
11.7
(% of Net Sales)
18.2
22.6
23.6
24.0
Depreciation& Amortisation
2,140
2,751
2,976
3,029
EBIT
4,648
7,110
8,152
9,404
% chg
8.2
53.0
14.7
15.4
(% of Net Sales)
12.4
16.3
17.3
18.2
Interest & other Charges
1,549
1,851
1,297
925
Other Income
438
540
550
470
(% of PBT)
12.4
9.3
7.4
5.3
Recurring PBT
3,538
5,799
7,405
8,950
% chg
(3.0)
63.9
27.7
20.9
Exceptional Items
-
-
-
-
Tax
1,107
1,798
2,295
2,774
Current & deferred tax
1,107
1,798
2,295
2,774
Taxation pertaining to earlier years
-
-
-
-
(% of PBT)
31.3
31.0
31.0
31.0
PAT (reported)
2,431
4,001
5,109
6,175
ADJ. PAT
2,431
4,001
5,109
6,175
% chg
(5.4)
64.6
27.7
20.9
(% of Net Sales)
6.5
9.2
10.8
11.9
Basic EPS (Rs)
88.7
138.6
177.0
214.0
Fully Diluted EPS (Rs)
88.7
138.6
177.0
214.0
% chg
9.7
56.3
27.7
20.9
Source: Company, Angel Research

5
UltraTech Cement | Q3FY2020 Result Update
January 30, 2020
5
Consolidated Balance Sheet
Y/E March (` cr)
FY2019
FY2020E
FY2021E
FY2022E
SOURCES OF FUNDS
Equity Share Capital
275
289
289
289
Reserves& Surplus
28,114
37,040
41,715
47,421
Shareholders Funds
28,389
37,329
42,004
47,710
Minority Interest
12
11
10
10
Total Debt
22,818
18,318
14,118
9,000
Other Liabilities
172
190
209
225
Net Deferred tax
3,542
4,325
5,324
5,324
Total Liabilities
54,934
60,172
61,665
62,270
APPLICATION OF FUNDS
Gross Block
49,715
58,178
59,678
60,278
Less: Acc. Depreciation
6,427
8,278
9,575
10,500
Net Block
43,289
49,901
50,451
50,921
Capital Work-in-Progress
1,122
900
800
600
Goodwill on Consolidation
2,847
2,847
2,847
2,847
Non current Investments
1,405
1,500
1,550
1,600
Other non-current assets
4,106
4,800
5,500
5,600
Current Assets
11,755
11,248
12,609
13,791
Investment
1,516
1,540
1,570
1,520
Inventories
3,585
3,800
4,030
4,380
Sundry Debtors
2,531
2,753
2,973
3,265
Cash & Bank Balance
707
741
1,220
1,761
Loans & Advances
3,415
2,415
2,815
2,865
Current liabilities
9,590
11,024
12,091
13,089
Net Current Assets
2,165
225
518
702
Total Assets
54,934
60,172
61,665
62,270
Source: Company, Angel Research

6
UltraTech Cement | Q3FY2020 Result Update
January 30, 2020
6
Consolidated Cash Flow
Y/E March (` cr)
FY2019
FY2020E
FY2021E
FY2022E
Net Profit
3,538
5,799
7,405
8,950
Depreciation
2,140
2,751
2,976
3,029
Interest
1,454
1,851
1,297
925
Change in Working Capital
(937)
1,642
(934)
(287)
Others
(325)
-
-
-
Taxes paid
(710)
(1,015)
(1,296)
(2,774)
Cash Flow from Operations
5,160
11,028
9,448
9,841
(Inc.)/ Dec. in Fixed Assets
(1,504)
(2,100)
(3,426)
(3,299)
(Inc.)/ Dec. in Investments
2,749
(659)
(630)
(470)
Cash Flow from Investing
1,245
(2,759)
(4,056)
(3,769)
Issue of Equity
5
-
-
-
Inc./(Dec.) in borrowings
(4,138)
(7,018)
(4,200)
(5,118)
Dividend(includind DDt)
(346)
(400)
(435)
(469)
Interest paid
(1,484)
(1,851)
(1,297)
(925)
Others
(83)
540
550
470
Cash Flow from Financing
(6,045)
(8,729)
(5,382)
(6,043)
Inc./(Dec.) in Cash
360
(459)
10
30
Opening Cash balances
77
437
(22)
(12)
Closing Cash balances
437
(22)
(12)
18
Source: Company, Angel Research
Key Ratios
Y/E March
FY2019
FY2020E
FY2021E
FY2022E
Valuation Ratio (x)
P/E (on FDEPS)
50.6
32.4
25.3
21.0
P/CEPS
24.9
17.2
14.3
14.1
P/BV
4.3
3.5
3.1
2.7
EV/Sales
4.0
3.3
3.0
2.6
EV/EBITDA
22.1
14.8
12.7
10.9
EV / Total Assets
10.1
11.8
10.1
8.9
Per Share Data (Rs)
EPS (Basic)
88.7
138.6
177.0
214.0
EPS (fully diluted)
88.7
138.6
177.0
214.0
Cash EPS
179.9
261.1
314.8
318.9
DPS
10.5
11.5
12.5
13.5
Book Value
1,033.7
1,293.4
1,455.4
1,653.1
Returns (%)
ROE
8.9
12.2
12.9
13.8
ROCE
9.6
13.3
14.6
16.7
Angel ROIC (Pre tax)
11.4
15.5
16.9
19.5
Source: Company, Angel Research (Valuation done as on 30/01/20)

7
UltraTech Cement | Q3FY2020 Result Update
January 30, 2020
7
Research Team Tel: 022 - 39357800 E-mail: research@angelbroking.com Website: www.angelbroking.com
DISCLAIMER
Angel Broking Limited (hereinafter referred to as “Angel”) is a registered Member of National Stock Exchange of India Limited,
Bombay Stock Exchange Limited and Metropolitan Stock Exchange Limited. It is also registered as a Depository Participant with CDSL
and Portfolio Manager and Investment Adviser with SEBI. It also has registration with AMFI as a Mutual Fund Distributor. Angel
Broking Limited is a registered entity with SEBI for Research Analyst in terms of SEBI (Research Analyst) Regulations, 2014 vide
registration number INH000000164. Angel or its associates has not been debarred/ suspended by SEBI or any other regulatory
authority for accessing /dealing in securities Market. Angel or its associates/analyst has not received any compensation / managed or
co-managed public offering of securities of the company covered by Analyst during the past twelve months.
This document is solely for the personal information of the recipient, and must not be singularly used as the basis of any investment
decision. Nothing in this document should be construed as investment or financial advice. Each recipient of this document should
make such investigations as they deem necessary to arrive at an independent evaluation of an investment in the securities of the
companies referred to in this document (including the merits and risks involved), and should consult their own advisors to determine
the merits and risks of such an investment.
Reports based on technical and derivative analysis center on studying charts of a stock's price movement, outstanding positions and
trading volume, as opposed to focusing on a company's fundamentals and, as such, may not match with a report on a company's
fundamentals. Investors are advised to refer the Fundamental and Technical Research Reports available on our website to evaluate the
contrary view, if any
The information in this document has been printed on the basis of publicly available information, internal data and other reliable
sources believed to be true, but we do not represent that it is accurate or complete and it should not be relied on as such, as this
document is for general guidance only. Angel Broking Limited or any of its affiliates/ group companies shall not be in any way
responsible for any loss or damage that may arise to any person from any inadvertent error in the information contained in this report.
Angel Broking Limited has not independently verified all the information contained within this document. Accordingly, we cannot
testify, nor make any representation or warranty, express or implied, to the accuracy, contents or data contained within this document.
While Angel Broking Limited endeavors to update on a reasonable basis the information discussed in this material, there may be
regulatory, compliance, or other reasons that prevent us from doing so.
This document is being supplied to you solely for your information, and its contents, information or data may not be reproduced,
redistributed or passed on, directly or indirectly.
Neither Angel Broking Limited, nor its directors, employees or affiliates shall be liable for any loss or damage that may arise from or in
connection with the use of this information.
Disclosure of Interest Statement UltraTech Cement
1. Financial interest of research analyst or Angel or his Associate or his relative No
2. Ownership of 1% or more of the stock by research analyst or Angel or associates or relatives No
3. Served as an officer, director or employee of the company covered under Research No
4. Broking relationship with company covered under Research No
Ratings (Based on Expected Returns: Buy (> 15%) Accumulate (5% to 15%) Neutral (-5 to 5%)
Over 12 months investment period) Reduce (-5% to -15%) Sell (< -15%)
Hold (Fresh purchase not recommended)